
Long-term, there’s a very big role for milestones within Sifter. However, as our ambitions became grander, the task became more daunting. As a result, the feature simply continued to be delayed. Finally, I just sat down for a weekend and knocked out the functionality. I explicitly avoided any fancy reporting or visualizations for the sake of providing immediate relief to the teams that needed milestones to organize their issues into more digestible chunks. (Ourselves included.)
The result was some very basic milestone management functionality. It got the job done, but it wasn’t particularly convenient or powerful. However, by using a very basic version of the feature in the real-world, we were able to get a much better grasp of what we needed to do next.
MIlestones and the Dashboard
The most obvious pain-point with phase 1 of milestones was that it wasn’t easy to get a feel for the status of the current milestone or to dive right into the subset of issues that are assigned to me for the current milestone. Almost immediately, I began sketching ideas and thinking about what needed to be done.
Working Out the Concept
With most dashboards, there are two general types of questions. The first is status questions. These questions ask for data about your current position. The second is activity. These are questions about where you’ve been, what’s been accomplished, or what’s happening right now. Recognizing this distinction become the first step in rethinking our approach to the dashboard.
With Sifter, we had previously been trying to merge activity and status into one all-powerful dashboard. This made it difficult to get an overview of all of your projects because each project took up a significant amount of vertical space.
The new dashboard separates status and activity. While the activity view is still very basic at this point, there are some plans in the works to provide advanced filtering to help you view the activity that’s important to you. For now, though, that will have to wait until the next phase. So now Sifter is designed to provide a quick view of where the project and next milestone stand. Then, there’s an optional page for activity that will soon see even more improvements.
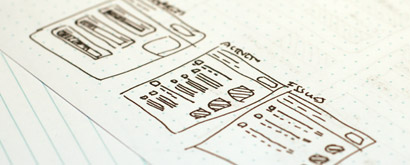
Rapidly Sketching Ideas
With new features, I’ve always found that the best way to make progress is to just sit down and start sketching and exploring. In this case, I started by thinking about the pieces of information that were relevant, and then tried to get them all into a reasonably concise format.
During the process, I tried to simplify the display to the absolute minimum. However, in doing so, I felt that I took it to far for the time being. All that really mattered was that we communicate the project’s completion and the milestone’s completion. Next, we need to provide immediate access to the outstanding issues so that you can get in and get to work.
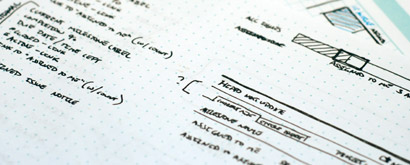
Once I felt comfortable with an idea, I like to rapidly iterate and create different versions making notes about my decisions along the way. At some point, I end up with a concept that I feel good about, and I move into Photoshop.
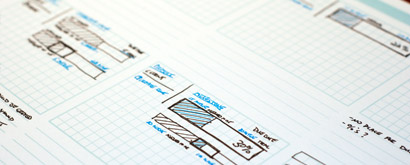
Exploring Designs
In the case of milestones, I invested a considerable amount of time mocking up detailed ideas. Unfortunately, I decided that they were great in theory, but that they would be too difficult to execute on successfully at this point. I may revisit the idea later, but it wasn’t worth it yet.
The ideas took on several different forms, and at no point did I feel committed to a particular idea. I just rapidly worked through all of the little ideas and tweaks until I’d get to a point where I was comfortable.
Some versions ended up having too much visual noise while others were too simple to work successfully in all of the different scenarios. Ultimately, it became more of a balancing act than an opportunity to really nail the design. Ultimately, I decided that getting a simpler workable solution out the door would give us an opportunity to make improvements over time.
The first iteration was too focused on being clean. It overlooked the value of visually separating the projects. Also, we wanted to feature the fact that projects could be sub-divided into milestones. By adding the link for administrators from the dashboard, we can hopefully draw attention to the feature so that everyone can get some benefit from it.
The other significant change was about preparing for a more advanced way to filter activity. Some customers who were managing many projects were frustrated by how crowded the dashboard became. It was very difficult to scan everything and get a quick overall feel. The activity summaries were a significant part of the overcrowding.
We also have plans for adding filtering options to the activity feed as well as displaying additional data. There was no room to add filtering options on the primary dashboard without making things incredibly crowded and confusing. This meant that activity would need a new home dedicated to it. In the first pass, we’ve simply increased the number of items displayed in the activity feed.
Summary
This is just the tip of iceberg, and nothing is written in stone. There’s plenty of room for improvement, feedback is always welcome, and we’d love to get some additional perspectives.